
Work

Real problems, practical fixes

A working transparency demo for local government, plus four in-house tools that run my own media business. Each one started the way a client project would. Client case studies will be added as projects are completed and clients agree to be shown.

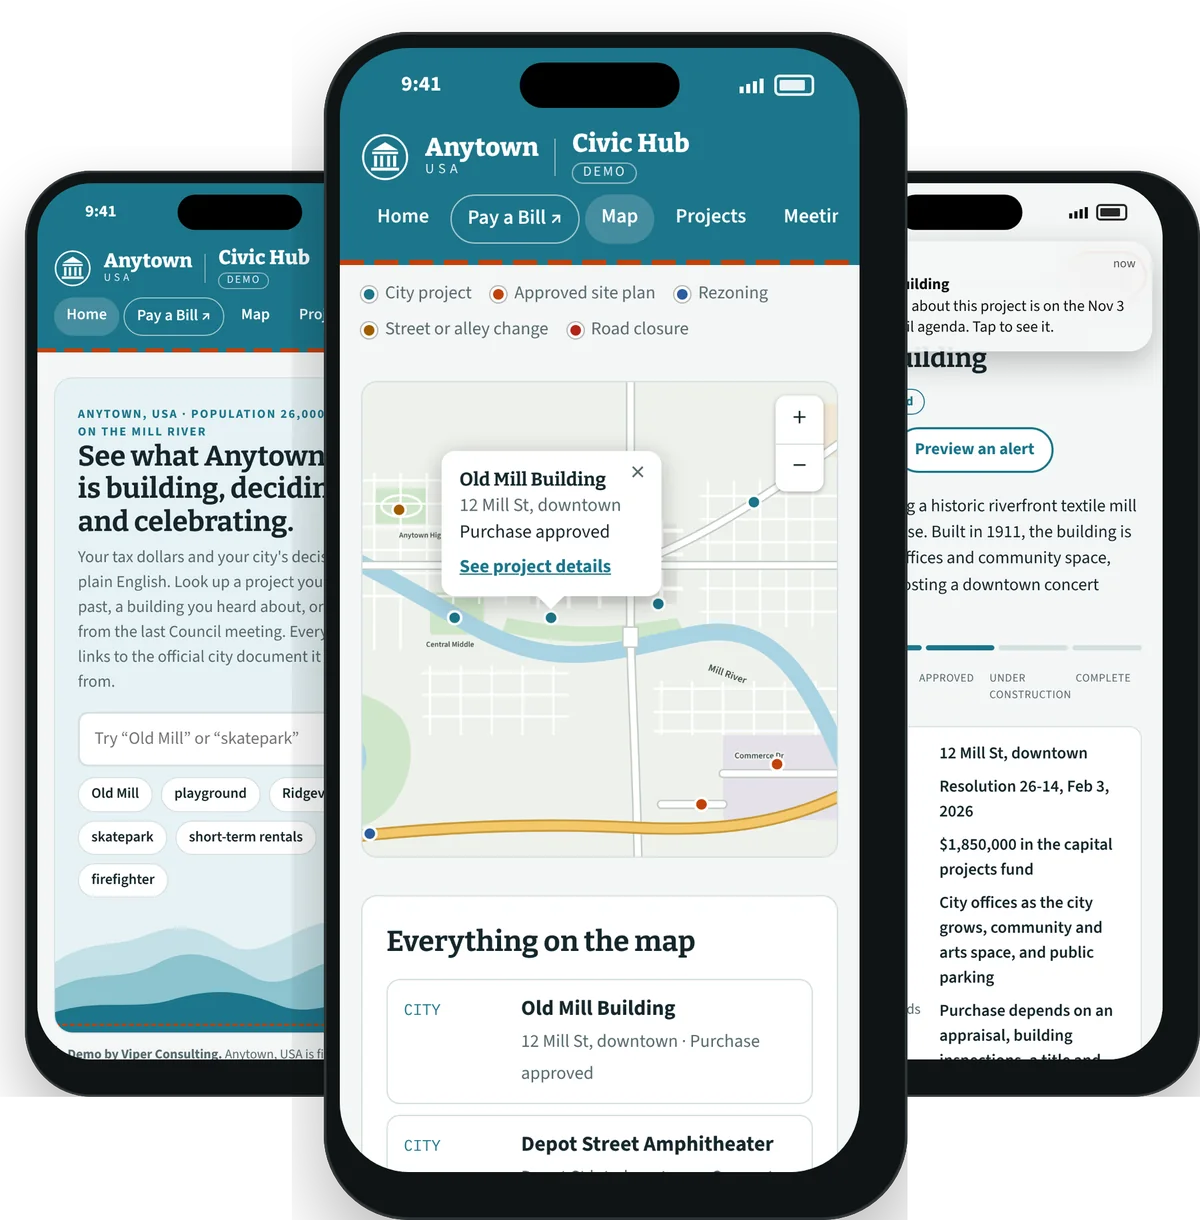
Three phone screens from the Civic Hub demo: the home page, a map of city projects, and an alert about a followed project

Working demo · Local government

Civic Hub

Problem
Cities publish every agenda, vote and budget, but it's buried in PDFs built for staff. Taxpayers can't see where their money goes or how decisions get made, so rumor fills the gap.
Build
A transparency hub that works in any browser or as an app on residents' phones and tablets: the budget in plain English with a tax calculator, every meeting sorted by topic, project timelines with who's paying, a map of what's being built, and alerts when a followed project is on the agenda, plus direct links to the city's existing services like bill pay, service requests and job listings. Residents can choose their home screen, including a large-text Easy View. Every fact links to the official record.
Result
A working demo built on a fictional town, ready to adapt for a city, county or community organization.

For your organization: show taxpayers how their city works, from one trusted place, and spend less staff time answering the same questions.
In-house · Workflow

Project Pipeline

Problem
Projects with many steps were tracked across notes, files and memory, so it was hard to see what was stuck or what came next.
Build
A shared pipeline board with stages, a step-by-step checklist for each project, a clear next action and a flag on anything that stalls.
Result
I run my own video production on it: every project has a status and a next step in one place, and nothing sits forgotten.

For your business: track jobs, quotes, service calls or a sales pipeline the same way, adapted to your own stages and steps.

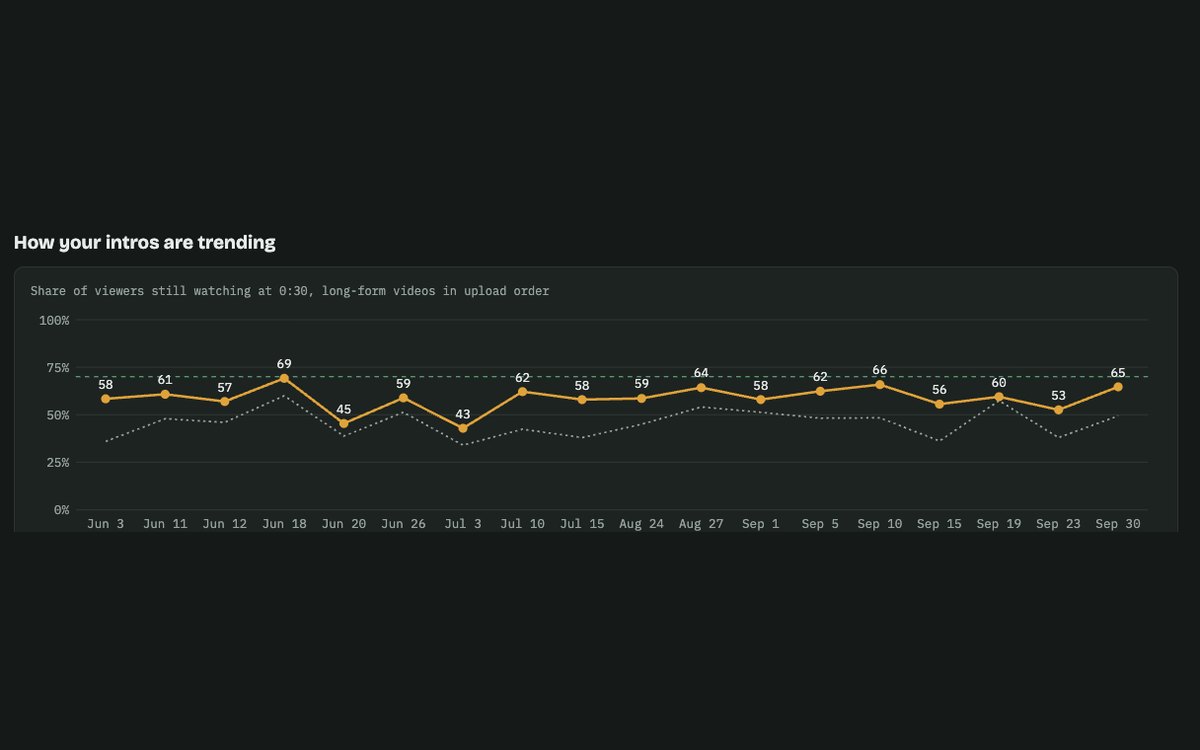
Screenshot of the Scoreboard chart tracking how many viewers stay past the first 30 seconds

In-house · Analytics

The Scoreboard

Problem
Channel performance was spread across different screens and reports, which made trends, like how many viewers stay past the intro, hard to see.
Build
An analytics scoreboard that pulls the important numbers into one view and charts them over time.
Result
Decisions about what to make next are based on numbers instead of guesses.

For your business: a weekly scorecard of sales, jobs, quotes or margins, without digging through reports.

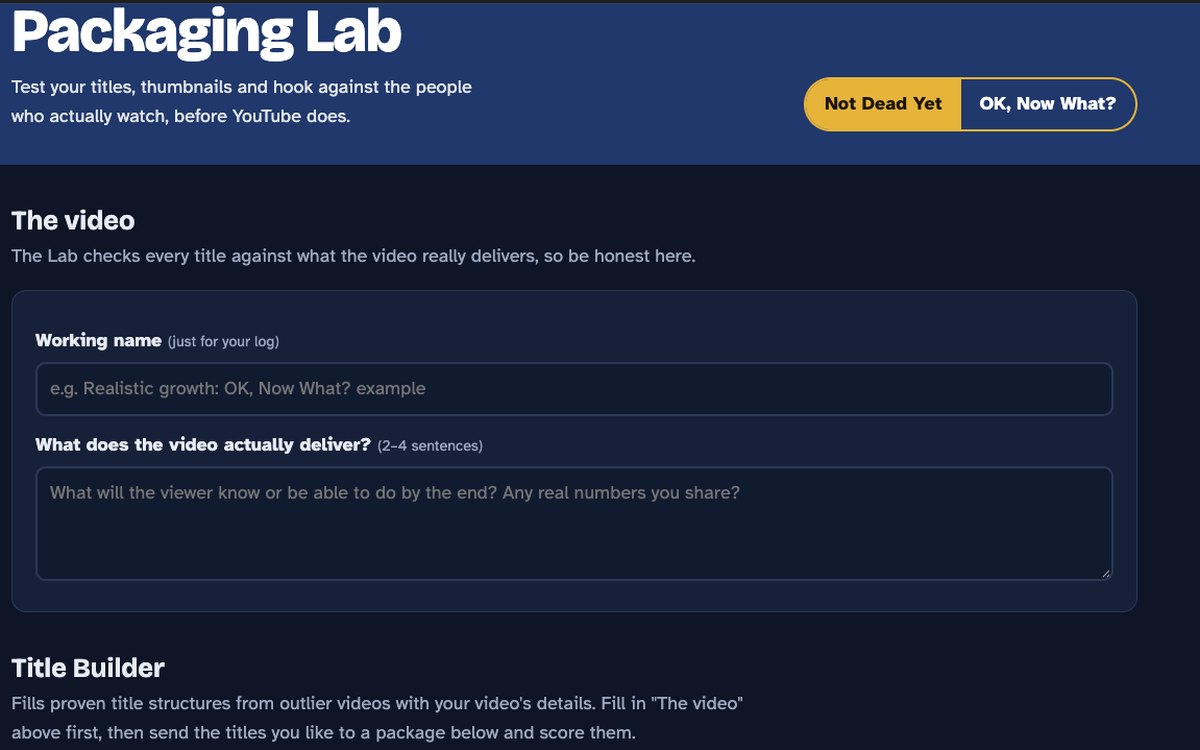
Screenshot of the Packaging Lab title builder

In-house · Testing

Packaging Lab

Problem
Titles and thumbnails were being decided at the last minute, on gut feel.
Build
A workspace that drafts titles from proven structures, checks each one against what the video actually delivers, and scores title and thumbnail packages.
Result
Packaging is tested before a video goes live instead of decided on gut feel.

For your business: a purpose-built tool for the one task your team repeats every week.

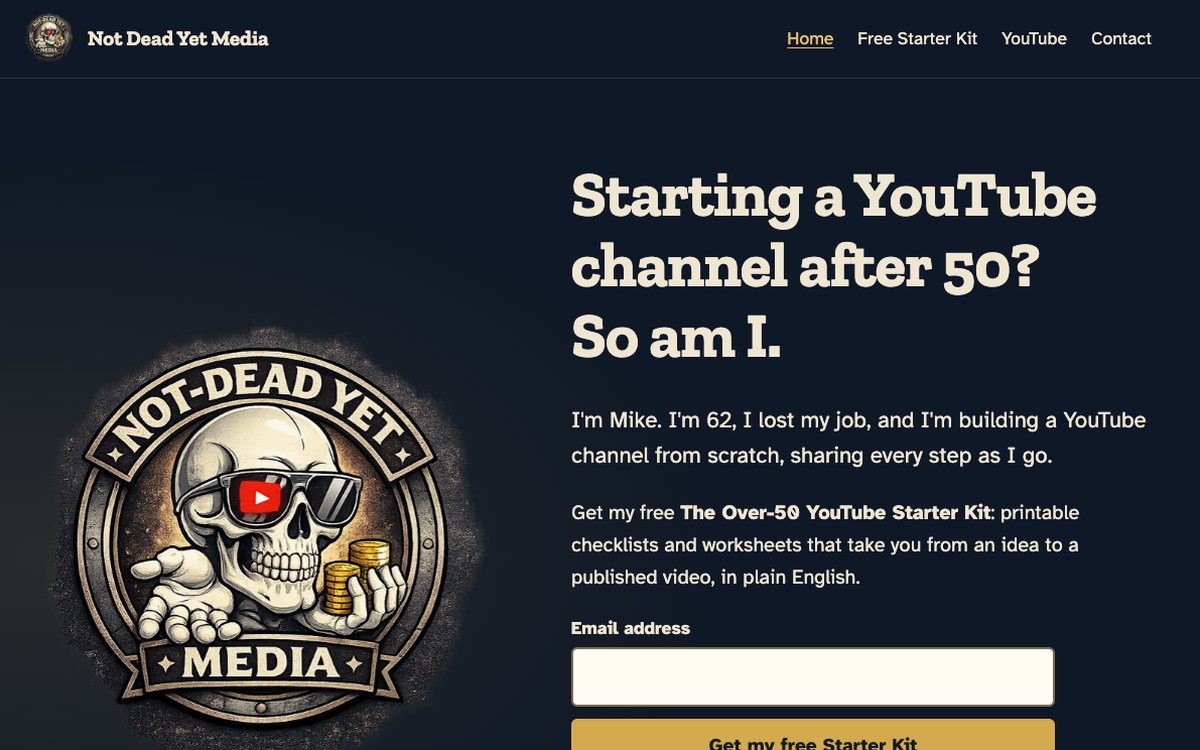
Screenshot of the Not Dead Yet Media website homepage

In-house · Website

Not Dead Yet Media

Problem
The channel needed a home base beyond YouTube to explain what it offers people over 50.
Build
A website designed, built and hosted in-house, with its own domain.
Result
The site is live, with a free starter kit that collects email sign-ups, and it's updated in-house as the channel grows.

For your business: a clean, fast website you can actually keep current. Visit ndy-media.com →

Picture a fix like these for your organization?

Tell me what you're tracking today and how. That's usually enough to sketch a first version.

Start a conversation